Analysis: Latitude vs. Cloudiness
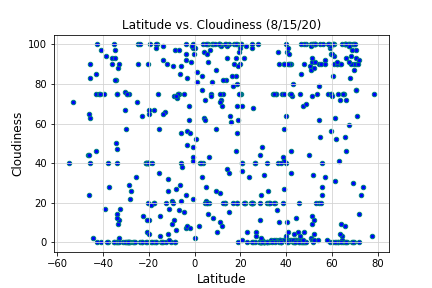
The cloudiness data shows pretty scattered results. It looks like the closer you are to the equater the more scattered the cloudiness. However, there are also some extremes. From -20 to -40ish and 20-75ish latitude, there are trends of clouds with 0%. However, there are also some trends of 100% cloudiness in the 20 - 75 range. Overall, there is no correlation between the two.
Visualizations
Cloudiness
Humidity
Temperature