Analysis: Latitude vs. Max Temperature
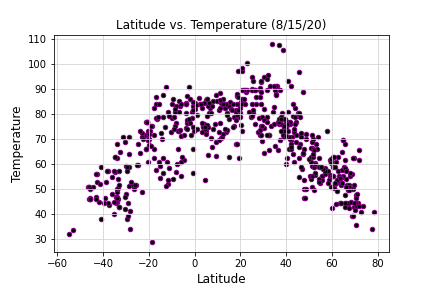
The temperature data shows that the cities that lie between 0 and about 40 degrees latitude are warmest. On the flip side, there are some cities that are both warm and cool from 0 to -20. I also found that from -60 to 0 there is a positive correlation, with temps increasing as latitude nears 0. Finally, there is a negative correlation from 0 to 80 and temps decrease as cities move further away from 0.
Visualizations
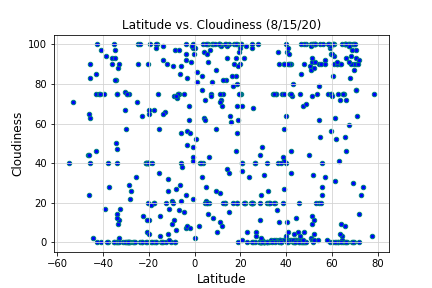
Cloudiness
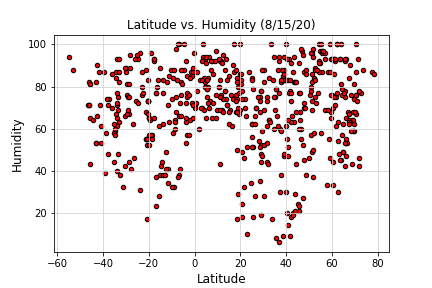
Humidity
Temperature